Improving First Shop Conversion
Technical details
Client
Quidco
Team
1 Product Designer, 2 Product Owners
Duration
6 Weeks
Year
2022
Category
Web and App
Skills
Data Analysis
Research
Wireframing
User Interface
Interaction Design
Customer Journey Mapping
Empathy Mapping
Conceptual Mapping
Personas
Flow Chart
Tools

Figma

Microsoft Clarity

UserZoom

Miro

Jira
Project overview
A significant challenge faced by our organisation was the low conversion rate of new sign-ups versus active users. At the time, 85% of new sign-ups exhibited no activity within the first 30 days of registration, posing a considerable obstacle to achieving our business objectives.
My role in this project was to lead a strategic initiative, that could help increase the first shop conversion rate. This meant collaborating with a cross-functional team including product owners and developers. My responsibilities included defining the problem, conducting user research, designing solutions, and validating those solutions through user-testing.
The steps I took
SUMMARY
01.
Define the problem
Set the foundational framework for crafting a successful solution.
02.
Data Analysis
Utilise available insights to inform decision-making throughout the design process.
03.
Qualitative Research
Conducted unmoderated testing with 15 participants along with a survey.
04.
User flow
Creating the ideal user experience with data-driven insights.
05.
Low Fidelity Wireframes
Roughly outline the basic structure and layout of the proposed changes.
06.
North Star Design
The ultimate vision based on user-centric design.
07.
Prototyping
Validate end-to-end design concept, gather any insights and usability issues.
08.
Outcome
Outcome of this project, identify lessons learned, and areas for improvement.
Problem definition and data insights gathering
Discovery
01.
Define the problem
By integrating the "Build-Measure-Learn" framework, I engaged in collaborative work and leveraged data-driven insights to define and refine the problem space. This iterative approach facilitated a deeper understanding of the problem, leading to the development of more effective solutions over time.
02.
Data Analysis
During the discovery phase, I used Google Analytics and Microsoft Clarity to understand how users behaved and what they needed. Google Analytics showed me things like which pages users visited most, where they exited the site, and how long they stayed. This helped me see how users moved around and where they got stuck. Microsoft Clarity gave me even more details, like heatmaps showing where users clicked the most and recordings of their actual interactions. By combining these tools, I got a clear picture of what users were doing and where they needed help. This guided my design decisions and led to solutions that will meet their needs effectively.
03.
Qualitative Research
During the ongoing discovery phase, I conducted an unmoderated test to observe how users were using our website in real-time. This allowed me to capture user behavior patterns, identify pain points, address recurring issues, and painpoint areas for general improvement. In conjuction with this, I sent out a survey to 100 participants so I could capture user shopping behaviors, aiming to gain insights into their habits and preferences when making purchasing decisions.
Brainstorming, wireframes and designs
Design

04.
User Flow
Using the data and insights available, I designed a user flow aimed at improving the overall experience and hopully increase conversion rates, keeping the user needs at the center of every decision.
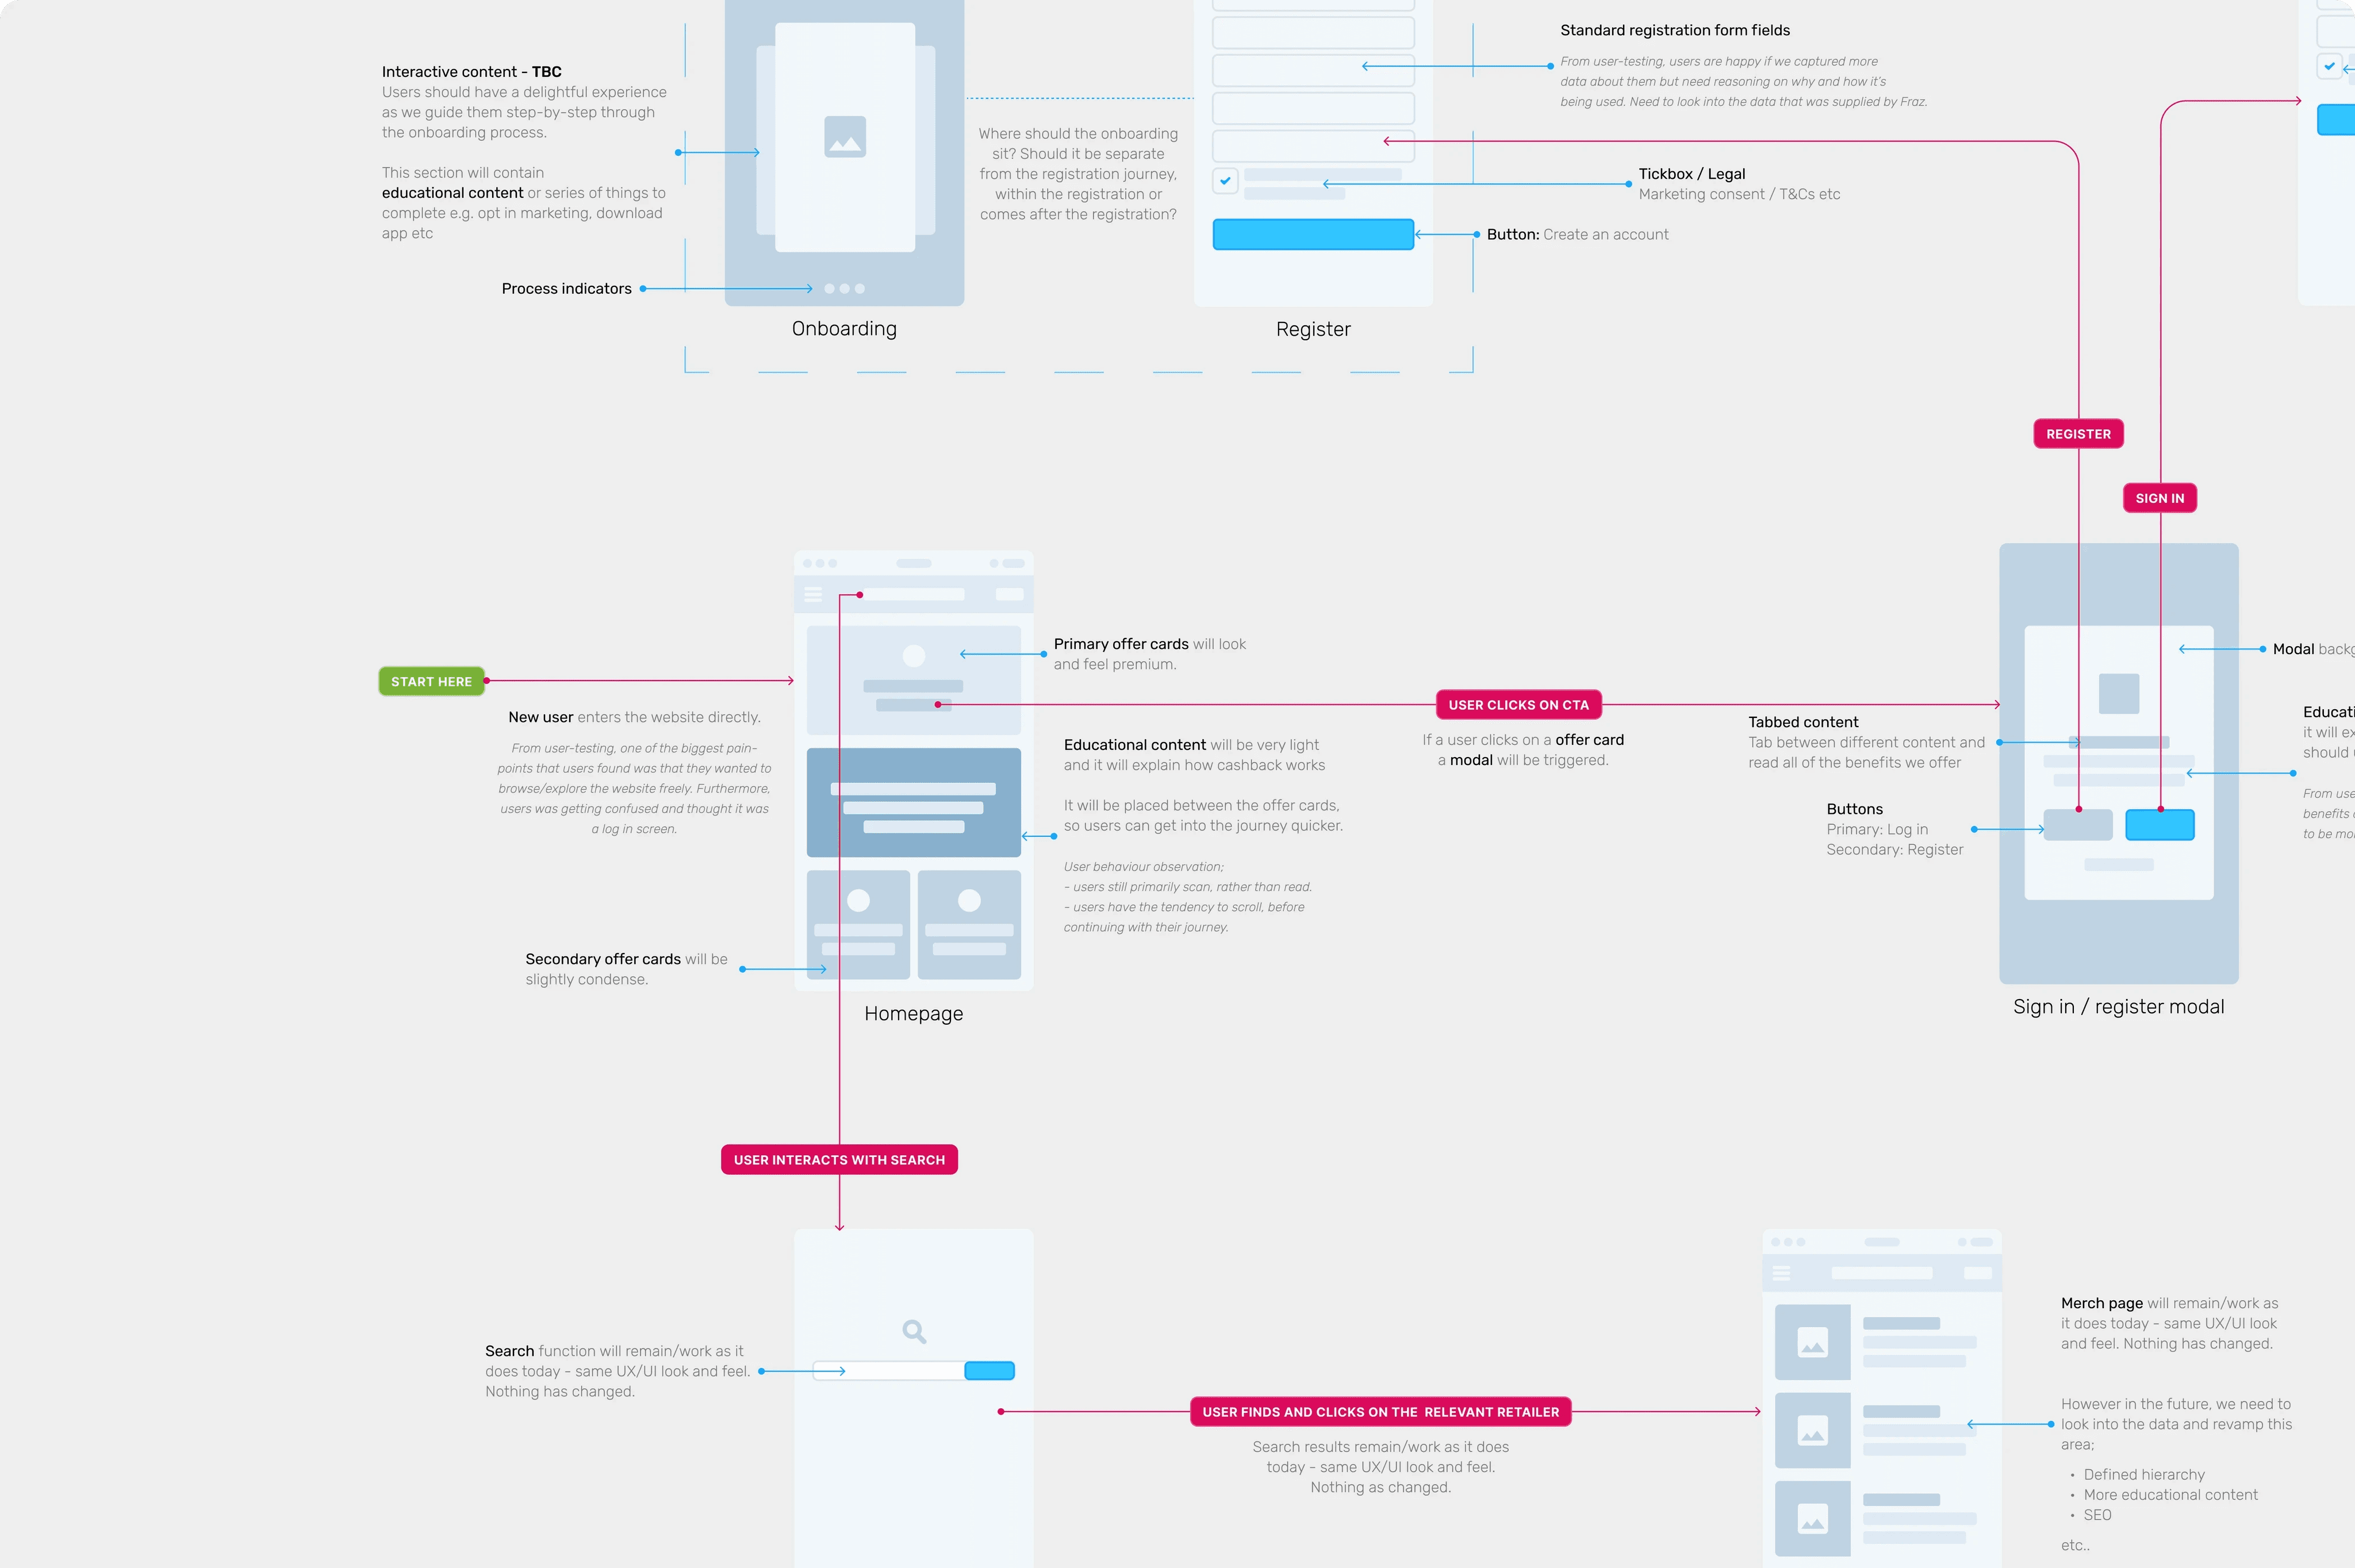
05.
Low Fidelity Wireframes
By creating low-fidelity wireframes, it enabled me to to quickly iterate and explore different design concepts. Because the wireframes were simple, I could easily share my ideas and get feedback from stakeholders and developers, in a collaborative way.
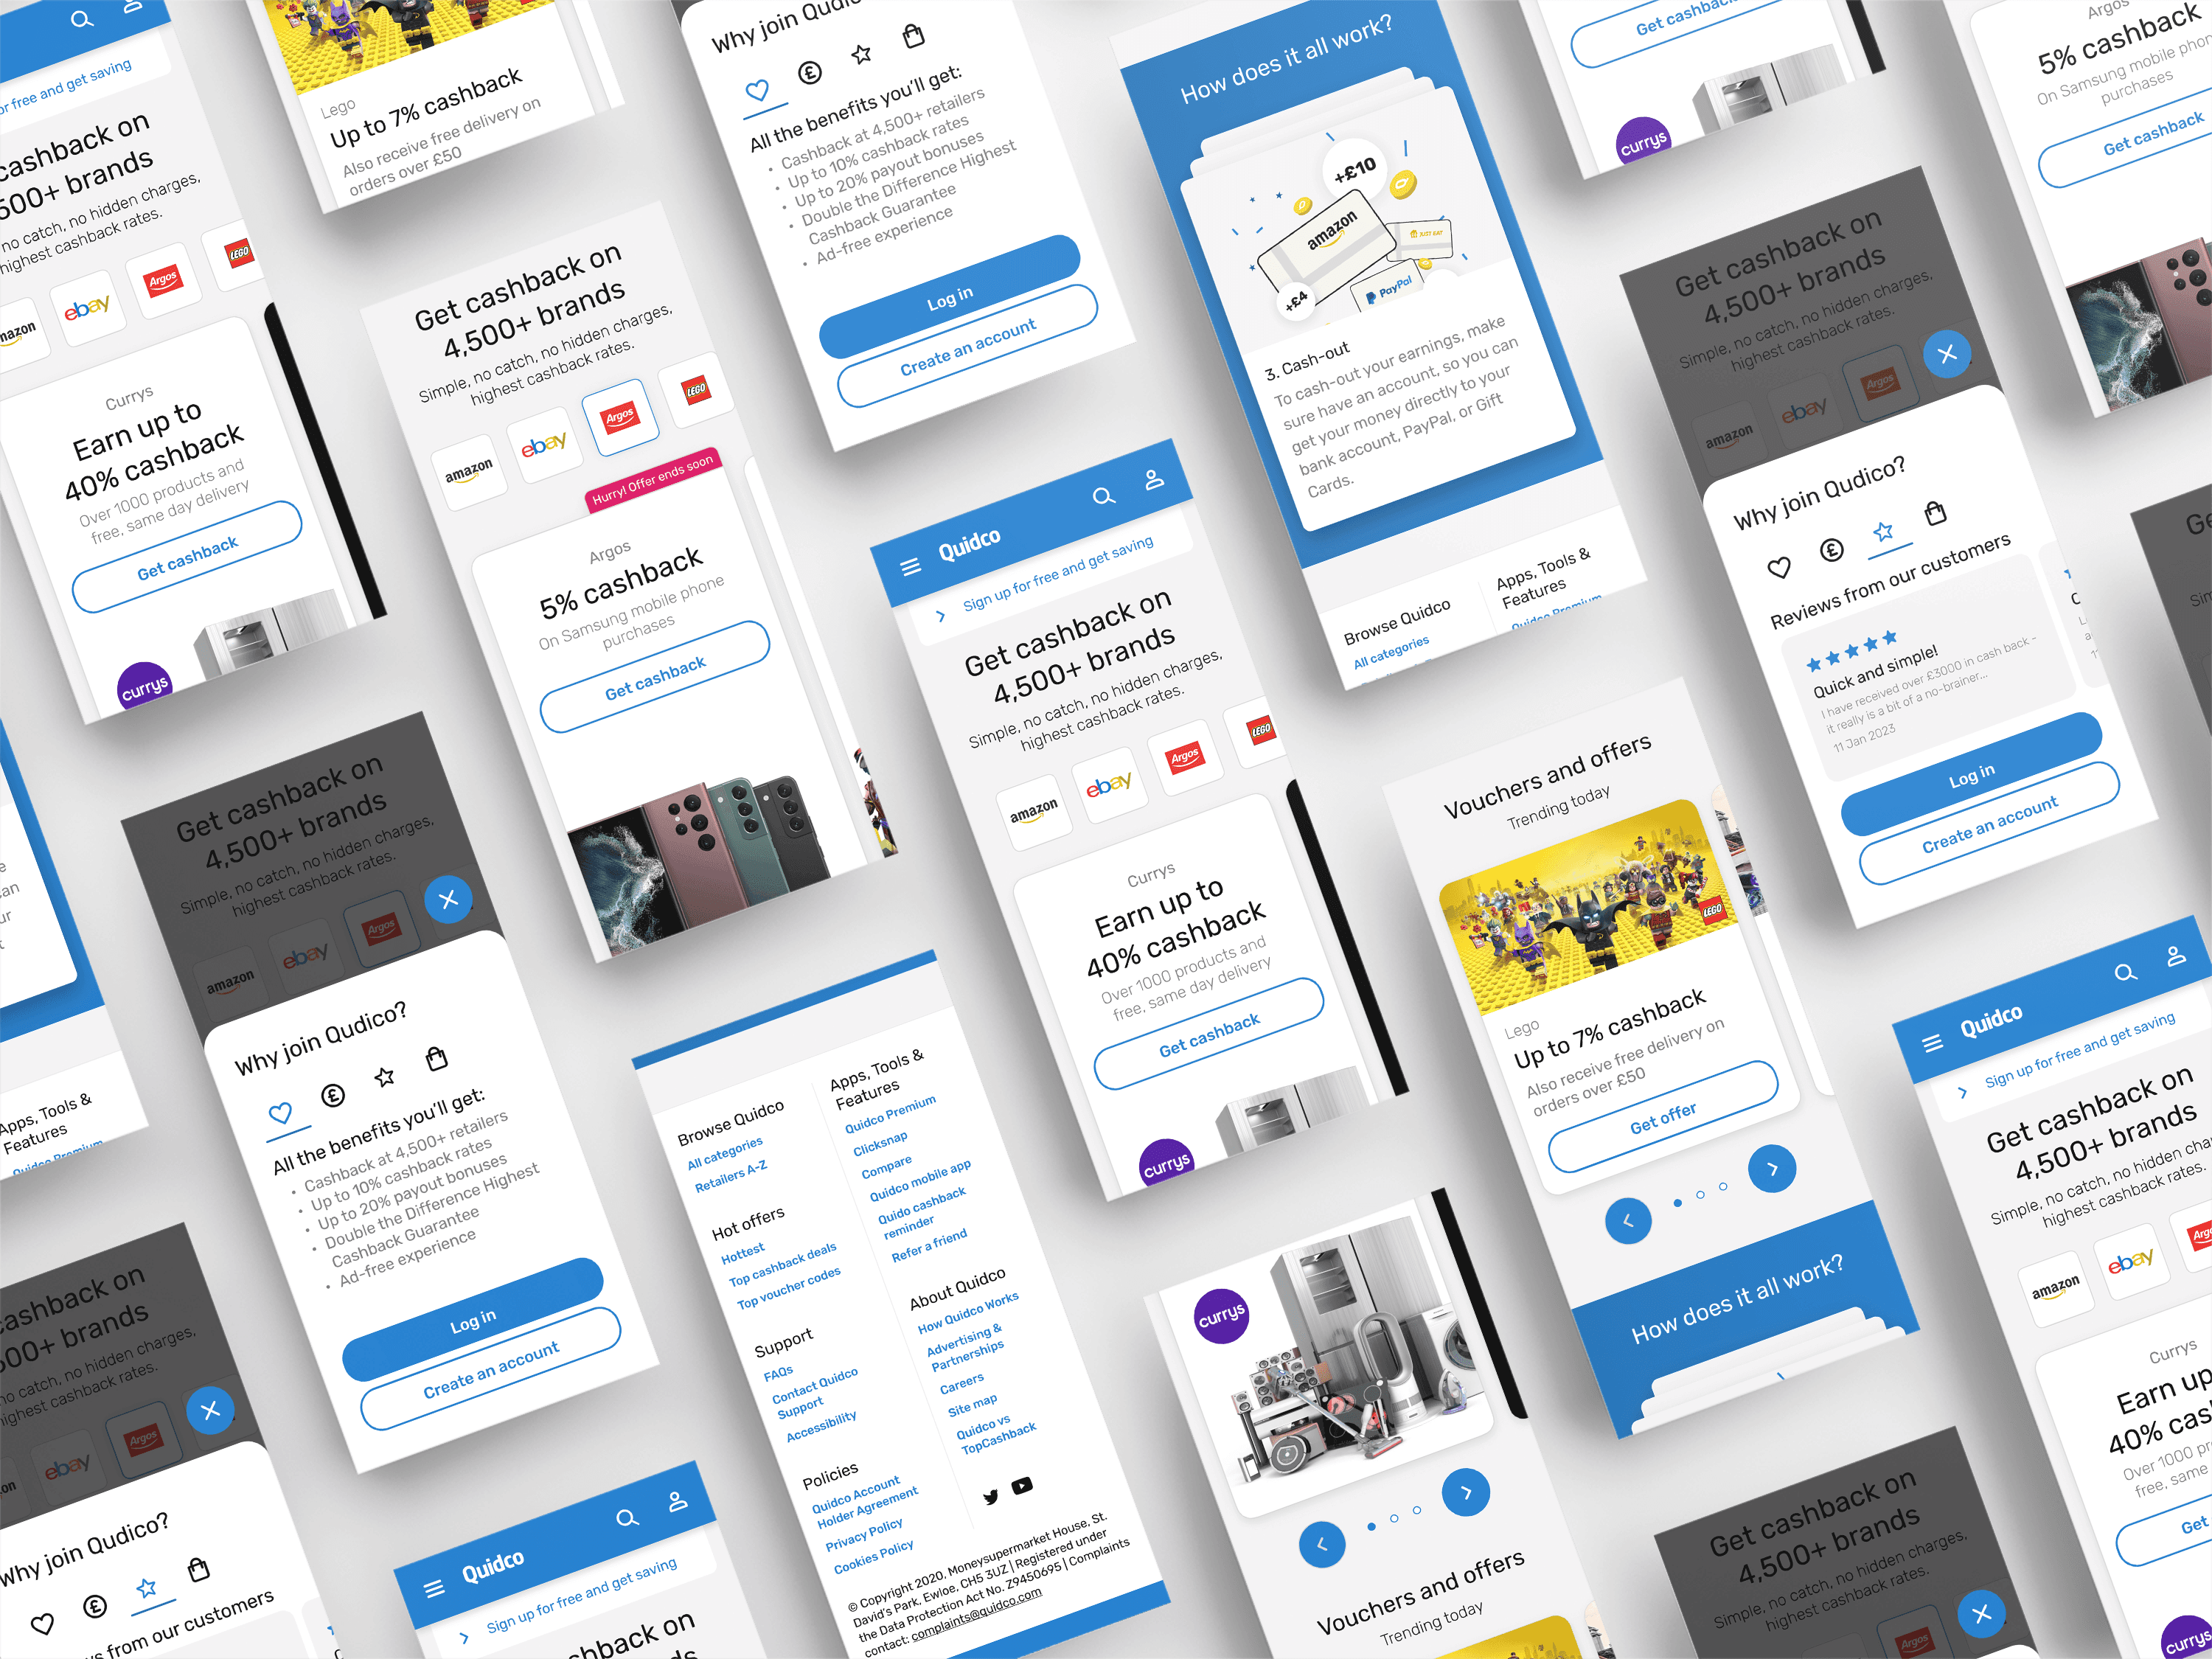
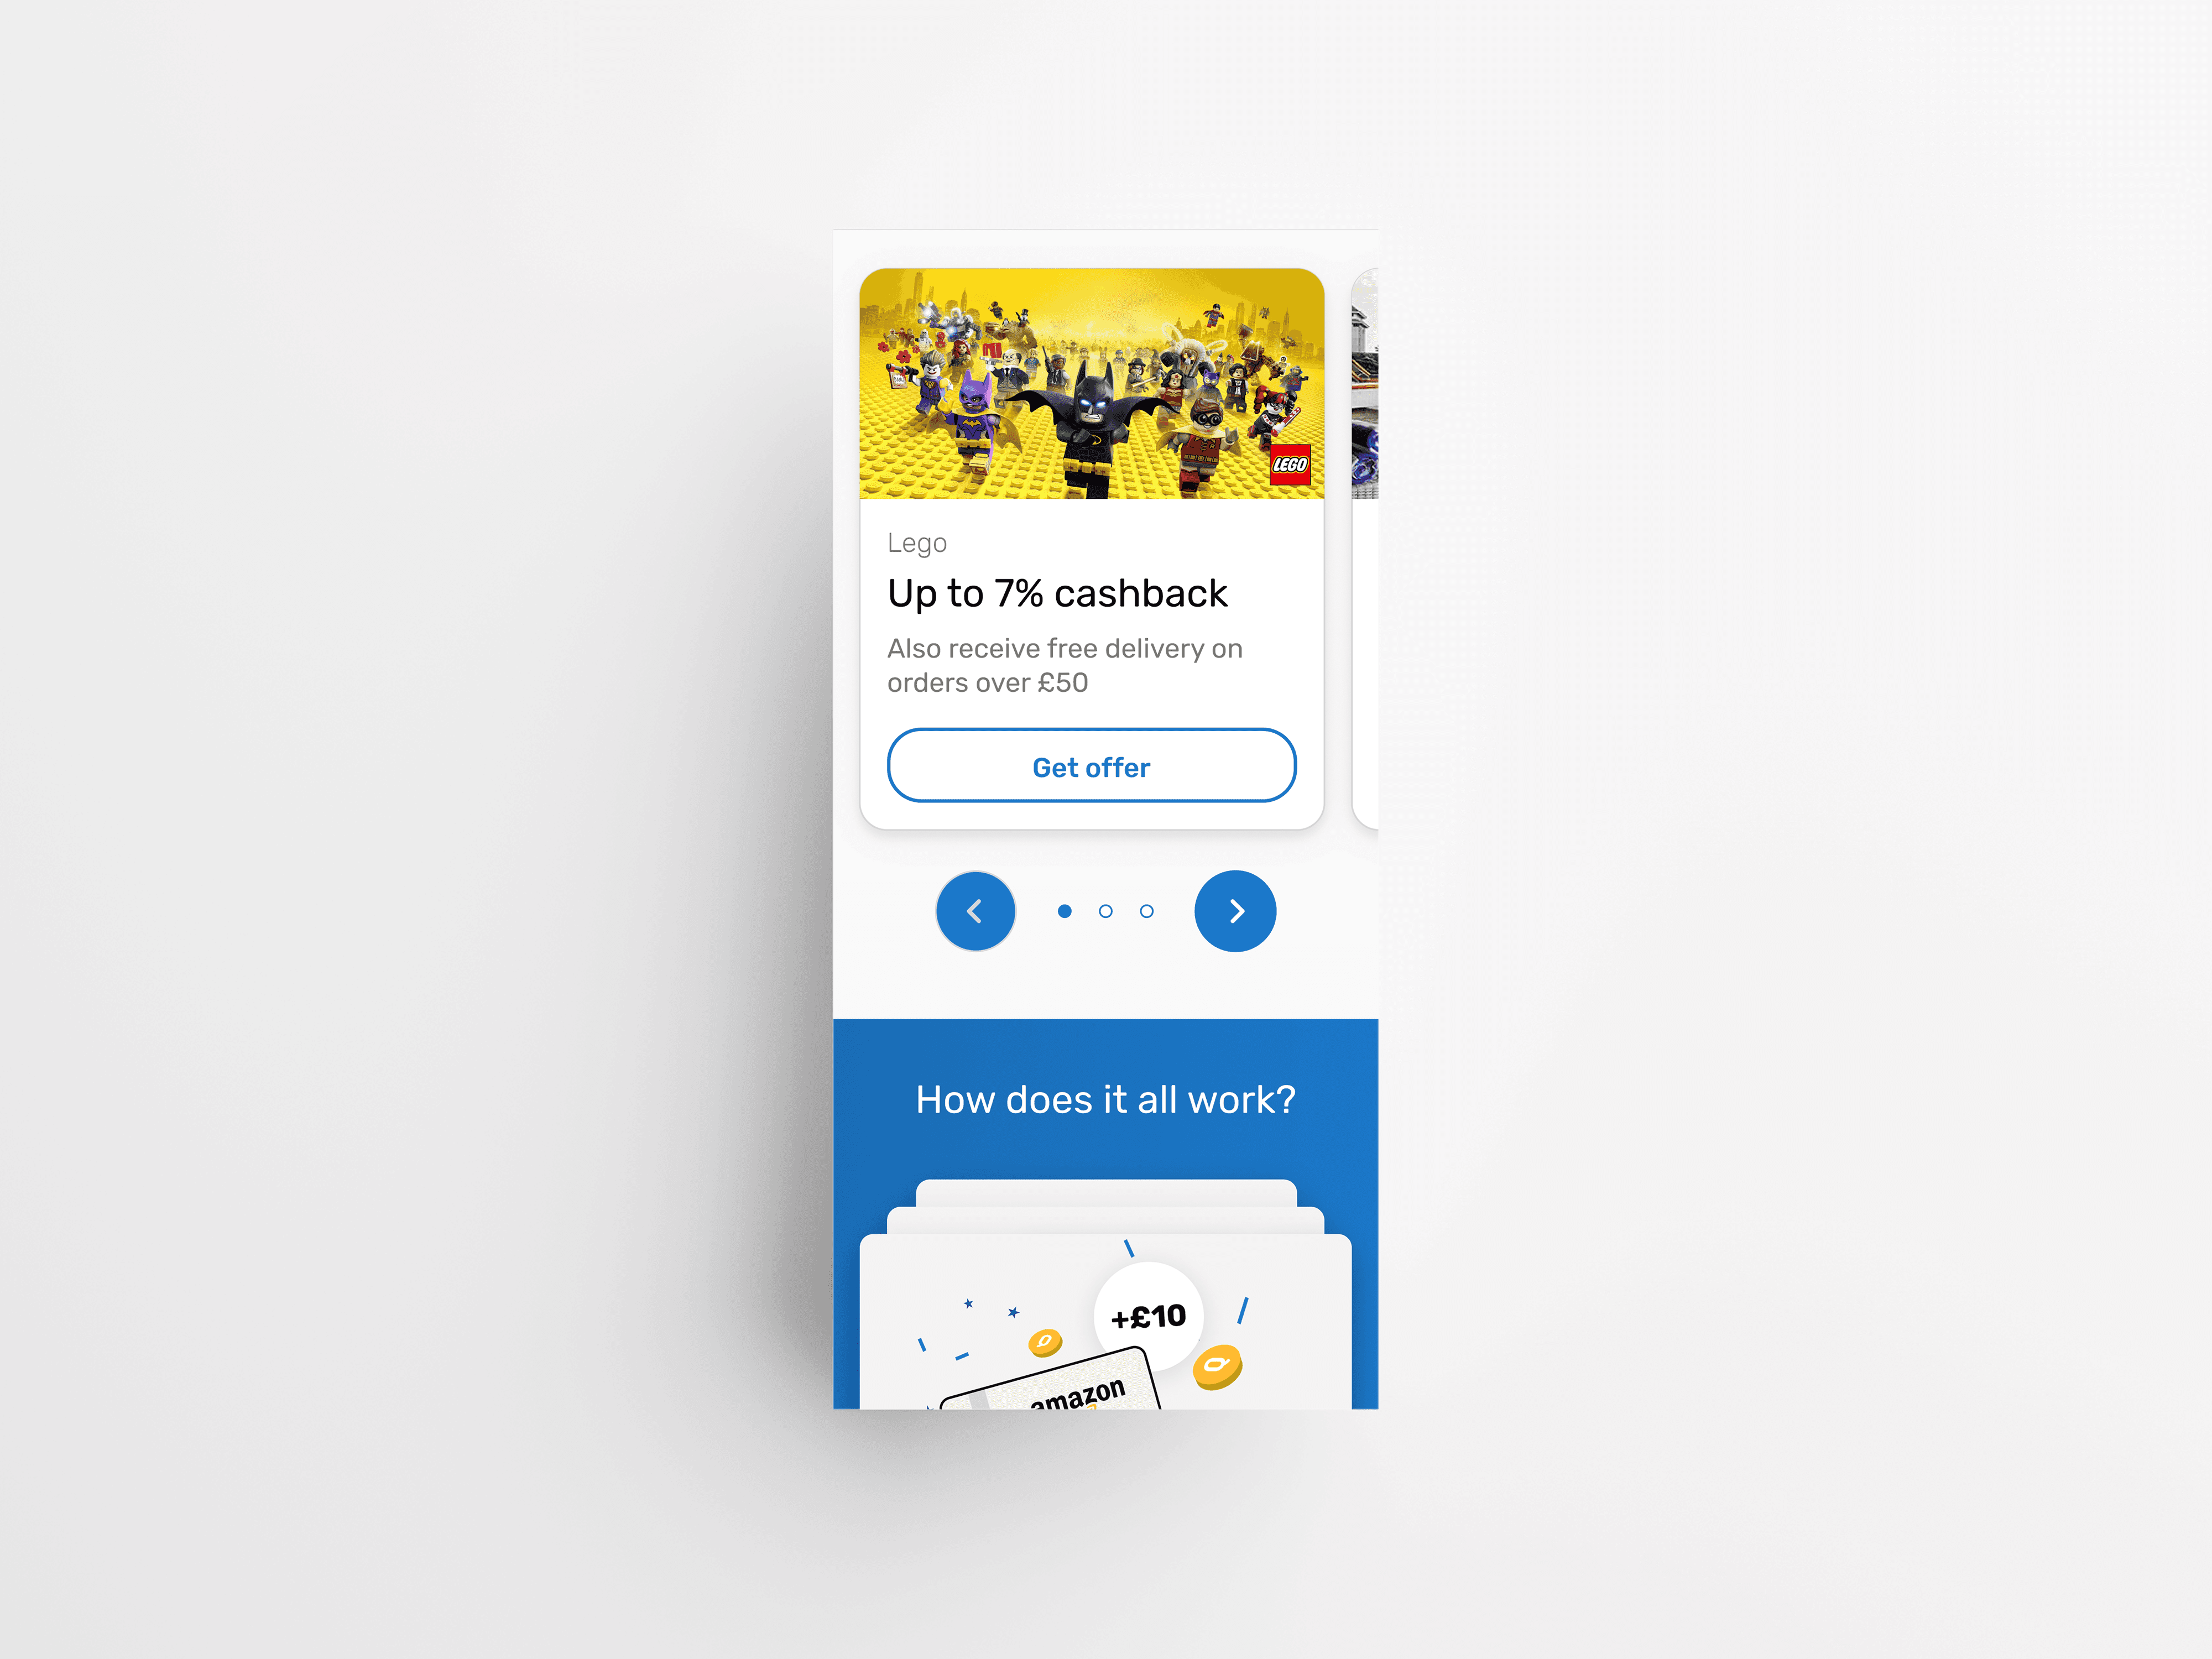
06.
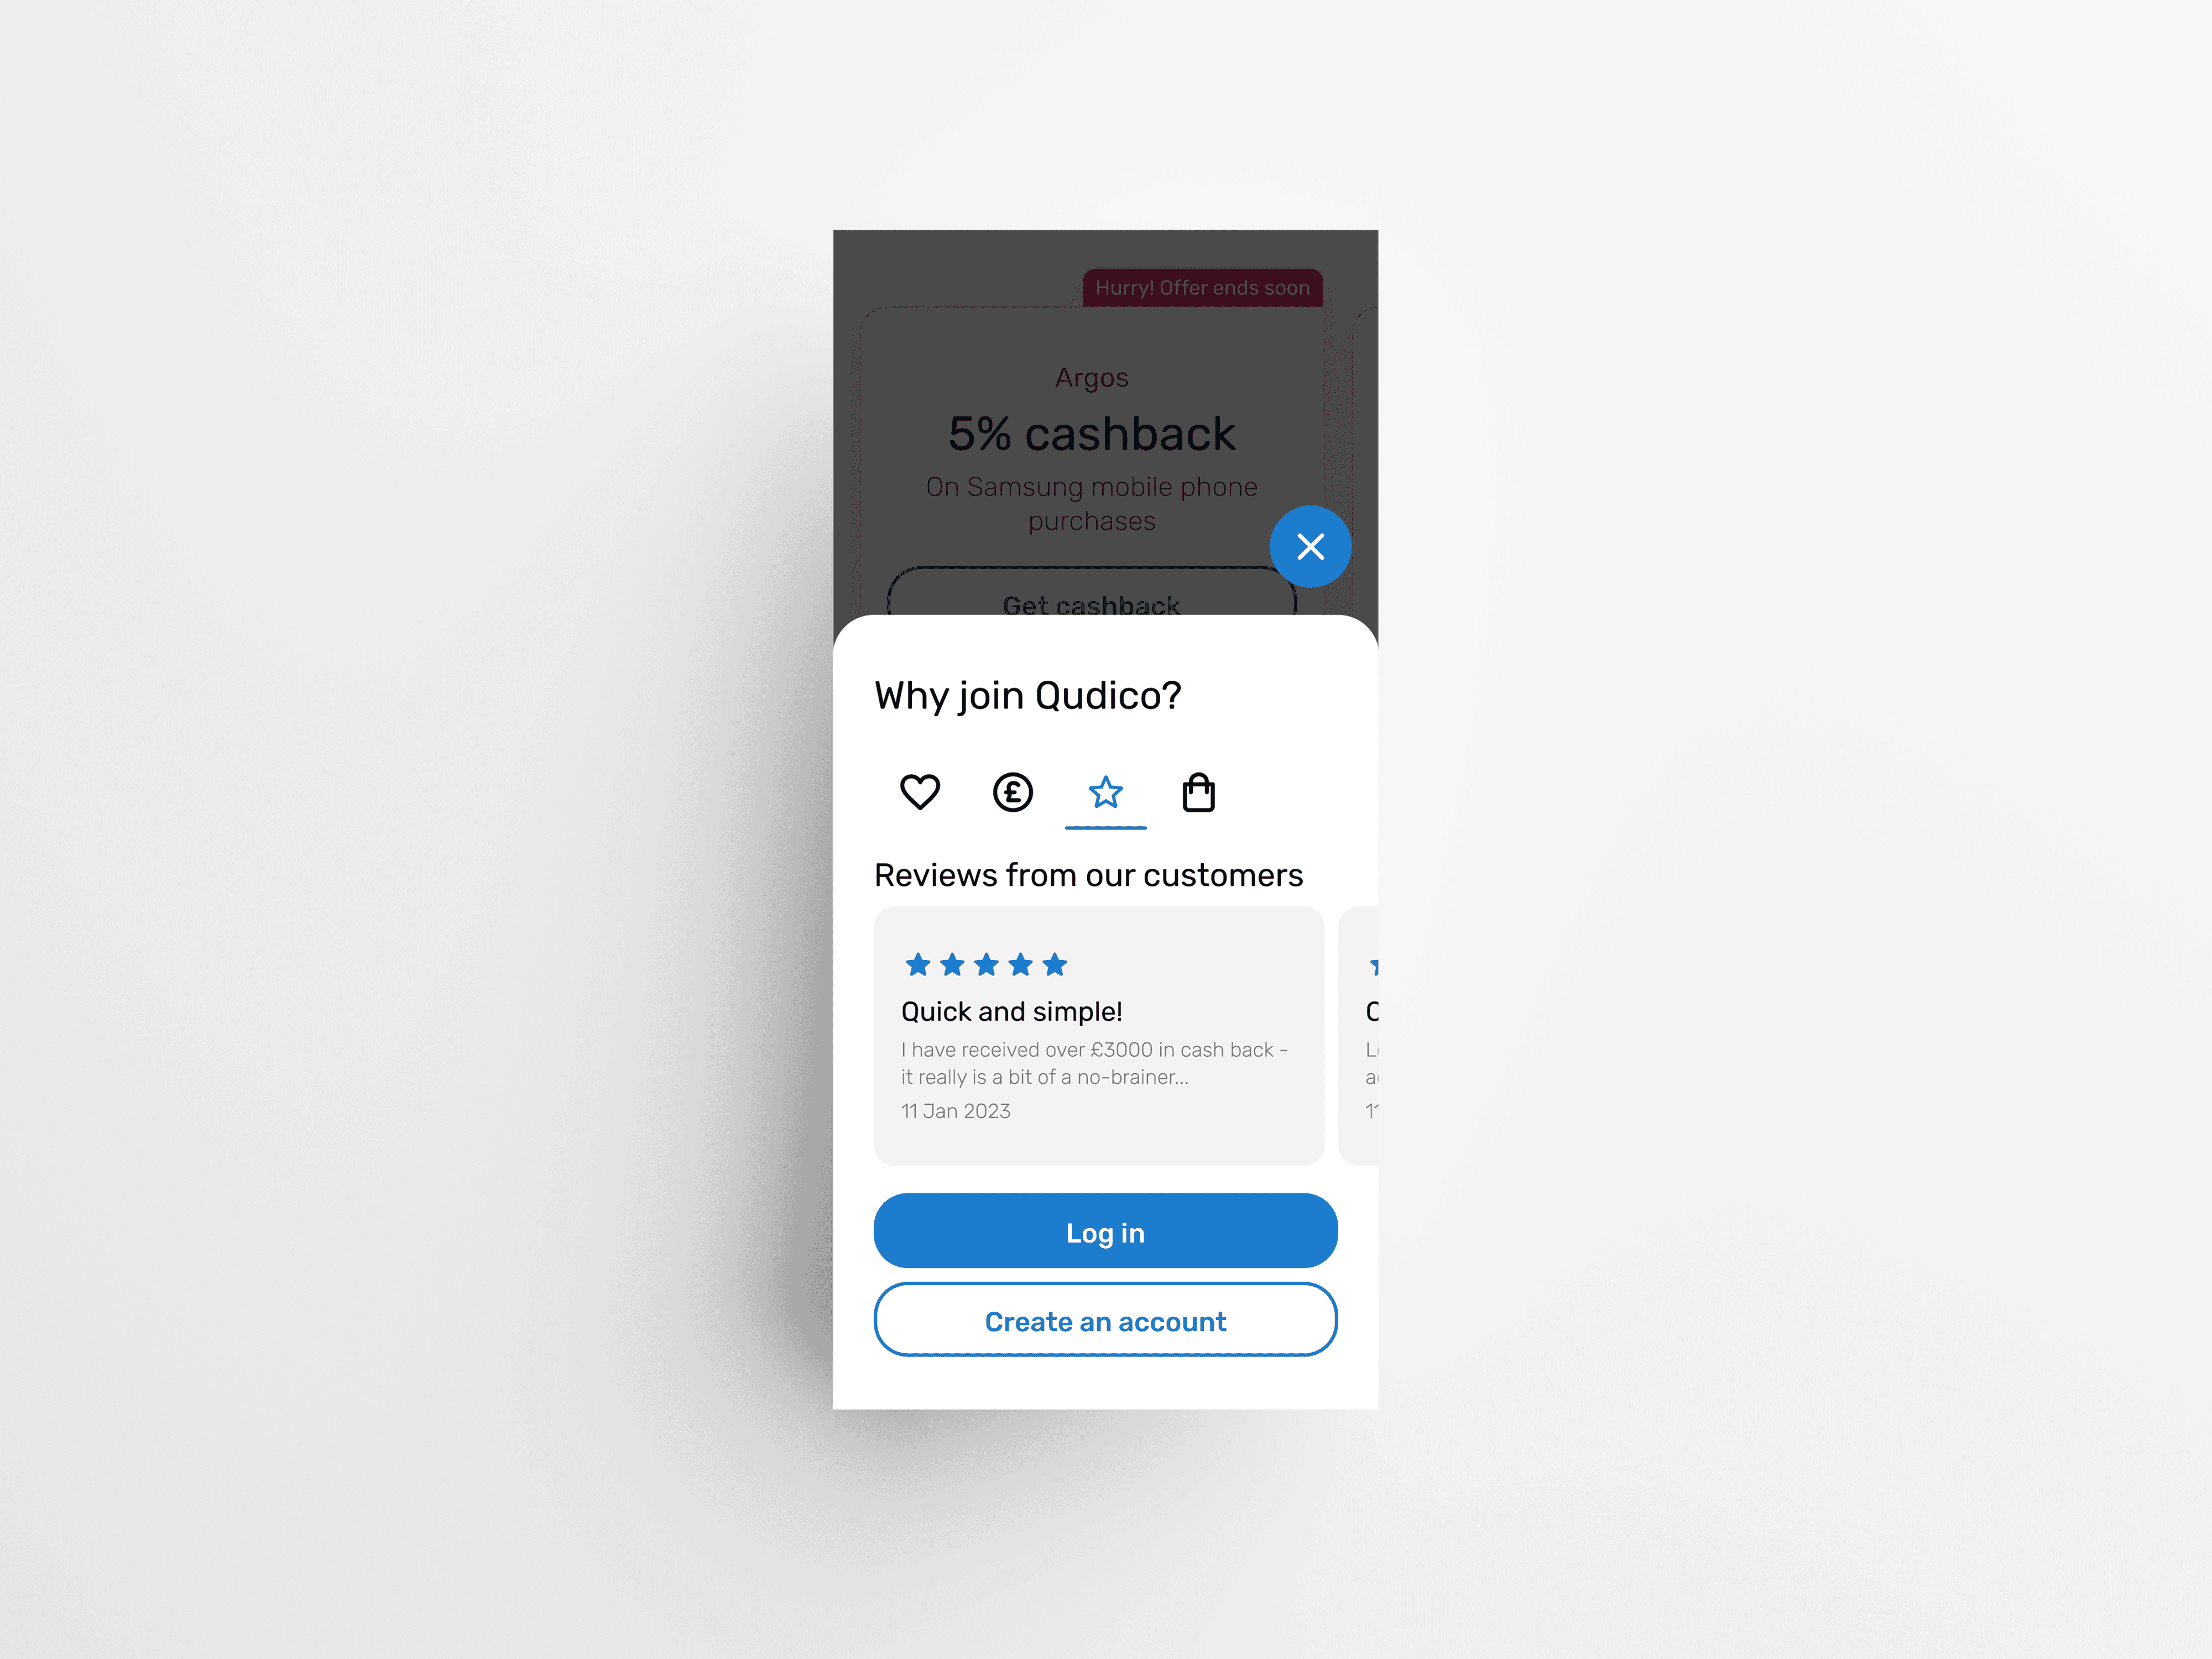
North Star Design
By adopting the North Star design approach, I was able to create a compelling and purposeful experience that not only achieves business objectives but also prioritises user needs. Key improvements include: - Ability to browse or compare the entire website, freely. - Reducing the pressure to register immediately and share personal credentials. - Introducing educational content explaining the benefits of joining Quidco and how cashback works. - Updating the website's design to enhance trustworthiness and modernise the user experience.
Validate hypotheses and design concepts
User testing
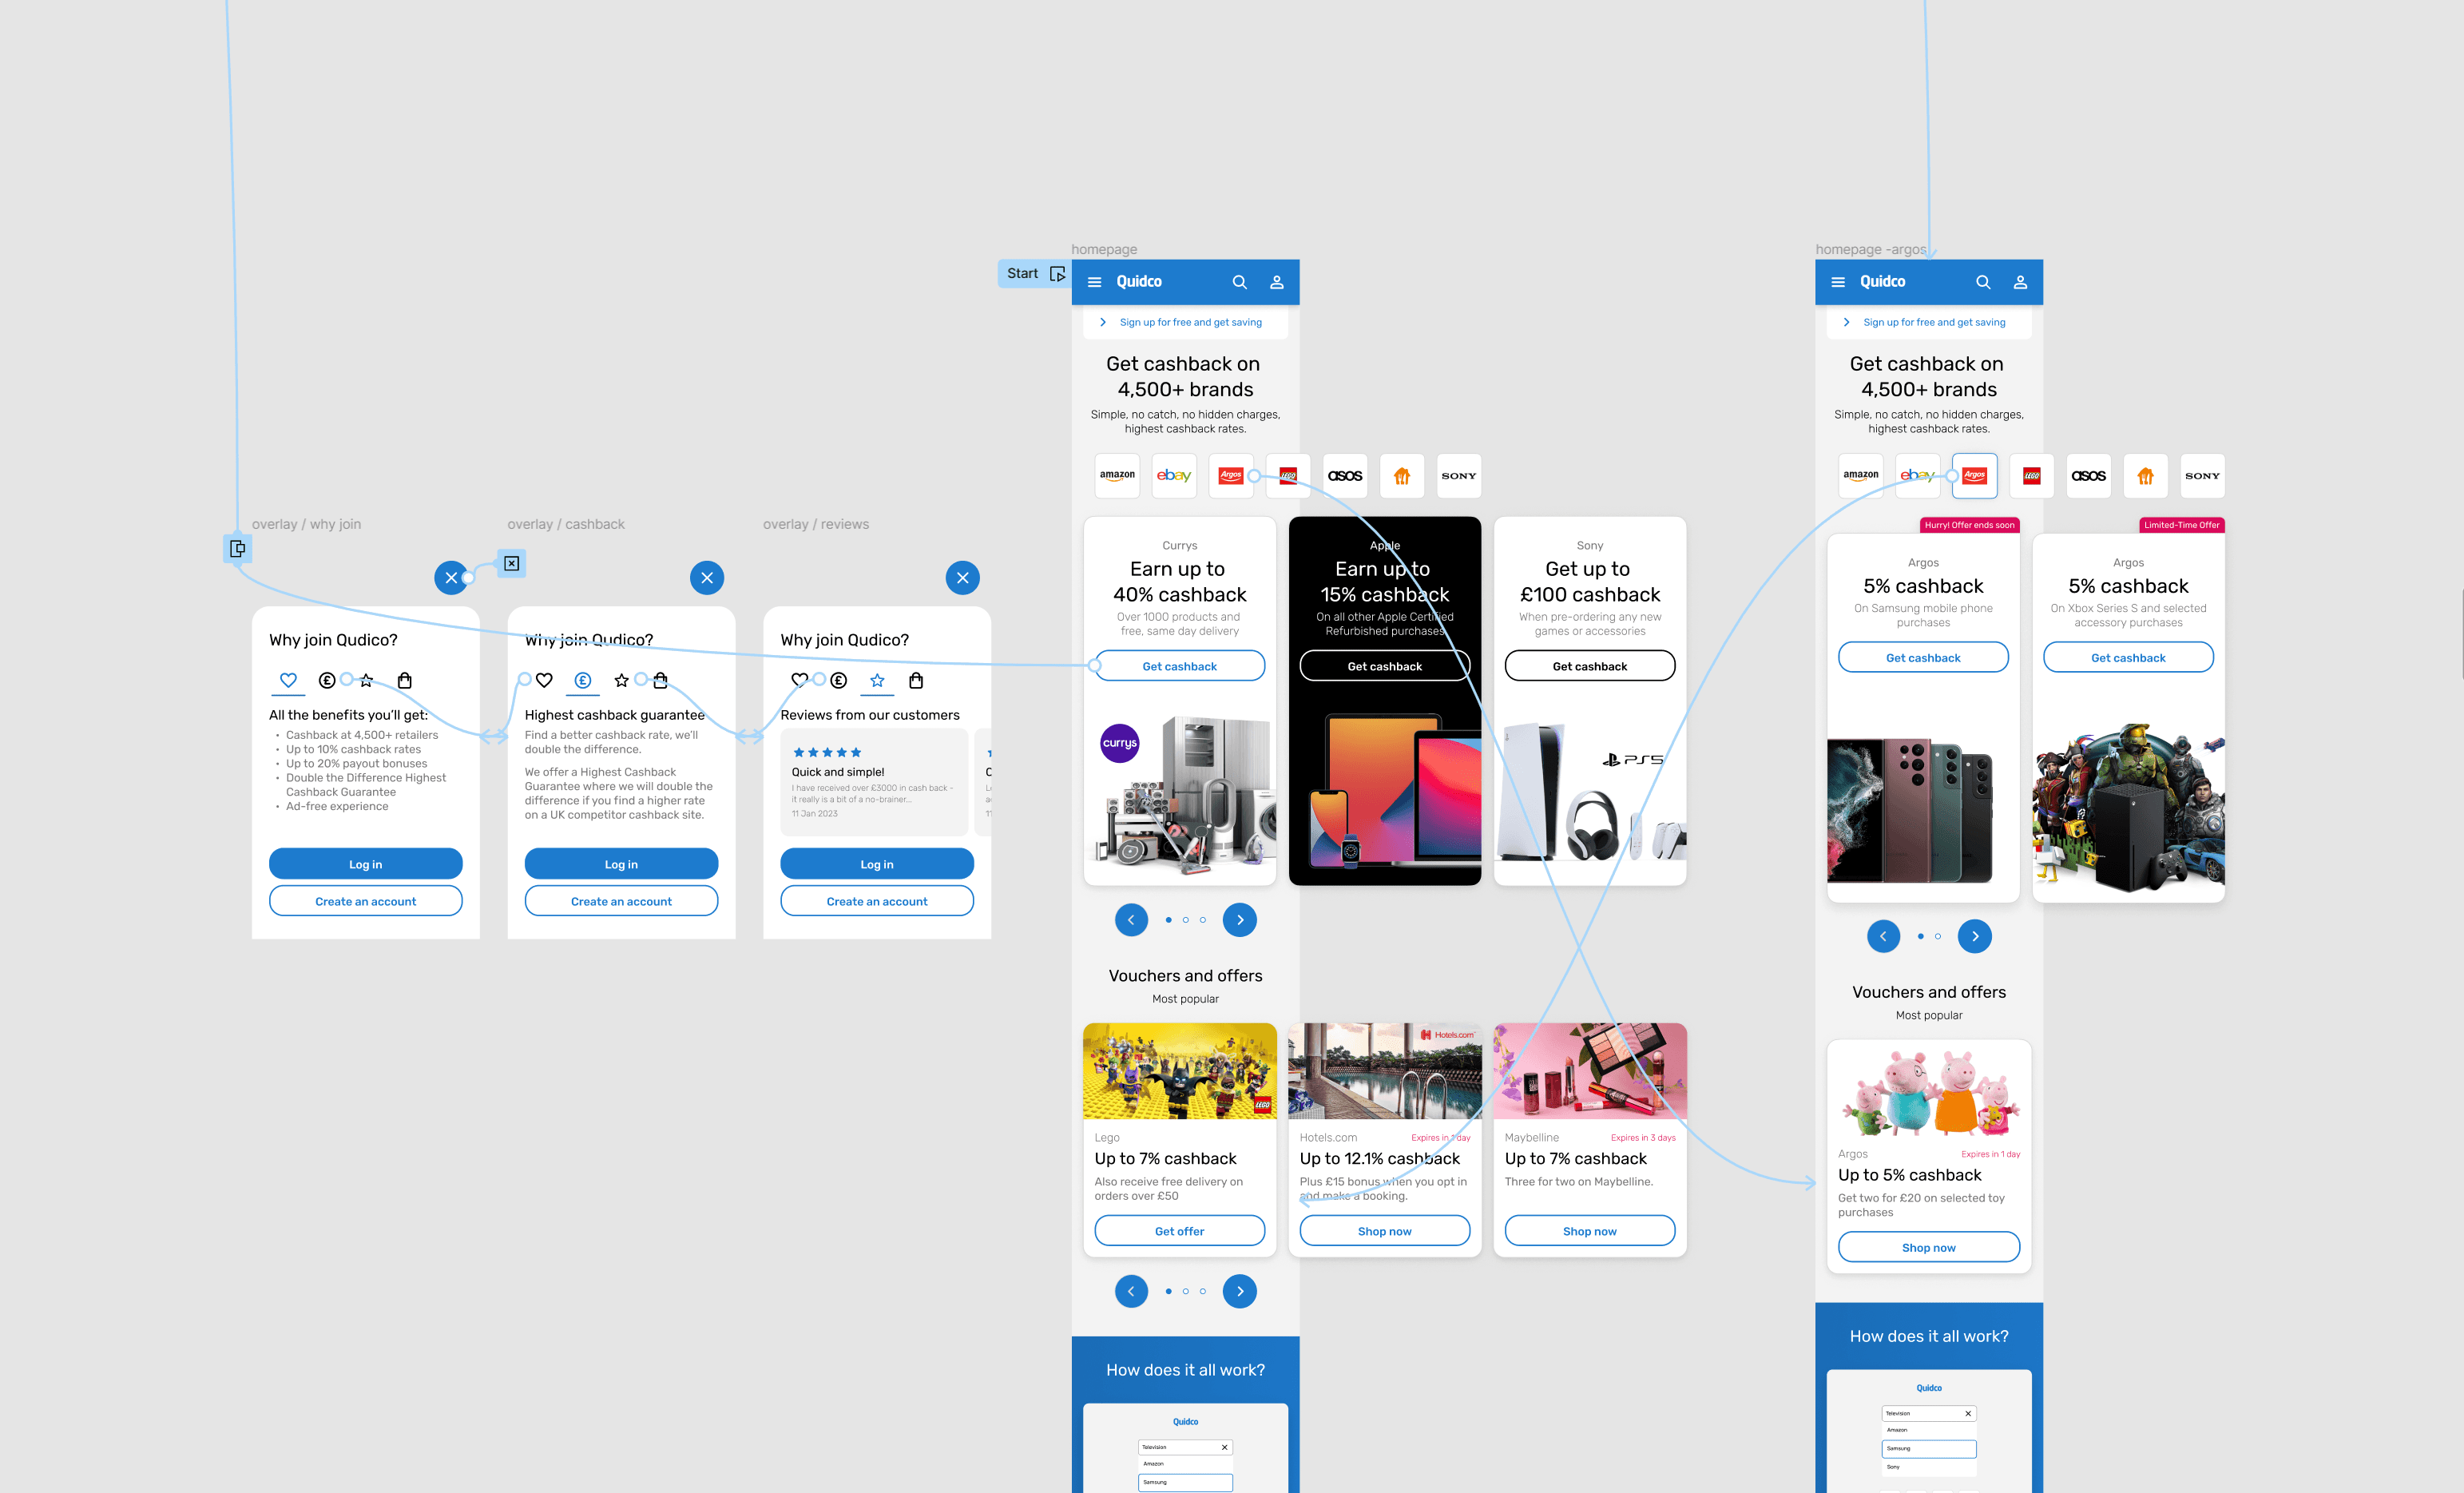
07.
Prototyping
Once the designs were completed, it was crucial to validate the design concepts and hypothesis with real users to determine whether the product should be developed further, refined, or discarded. Testing the prototype with real users allows for the identification of usability issues, gathering insights, and iterating on the design to enhance the overall user experience.
Outcome
Before I could validate my 'North Star' design concept, the project was put on hold due to organisational restructuring. However, insights generated by this workstream created a better understanding of user pain points, such usability issues, navigation challenges, and interface complexities, which was used in other projects.
MVP designs
DESIGN


Improving First Shop Conversion
Technical details
Client
Quidco
Team
1 Product Designer, 2 Product Owners
Duration
6 Weeks
Year
2022
Category
Web and App
Skills
Data Analysis
Research
Wireframing
User Interface
Interaction Design
Customer Journey Mapping
Empathy Mapping
Conceptual Mapping
Personas
Flow Chart
Tools
Figma
Microsoft Clarity
UserZoom
Miro
Jira
Project overview
A significant challenge faced by our organisation was the low conversion rate of new sign-ups versus active users. At the time, 85% of new sign-ups exhibited no activity within the first 30 days of registration, posing a considerable obstacle to achieving our business objectives.
My role in this project was to lead a strategic initiative, that could help increase the first shop conversion rate. This meant collaborating with a cross-functional team including product owners and developers. My responsibilities included defining the problem, conducting user research, designing solutions, and validating those solutions through user-testing.
The steps I took
SUMMARY
01.
Define the problem
Set the foundational framework for crafting a successful solution.
02.
Data Analysis
Utilise available insights to inform decision-making throughout the design process.
03.
Qualitative Research
Conducted unmoderated testing with 15 participants along with a survey.
04.
User flow
Creating the ideal user experience with data-driven insights.
05.
Low Fidelity Wireframes
Roughly outline the basic structure and layout of the proposed changes.
06.
North Star Design
The ultimate vision based on user-centric design.
07.
Prototyping
Validate end-to-end design concept, gather any insights and usability issues.
08.
Outcome
Outcome of this project, identify lessons learned, and areas for improvement.
Problem definition and data insights gathering
Discovery
01.
Define the problem
By integrating the "Build-Measure-Learn" framework, I engaged in collaborative work and leveraged data-driven insights to define and refine the problem space. This iterative approach facilitated a deeper understanding of the problem, leading to the development of more effective solutions over time.
02.
Data Analysis
During the discovery phase, I used Google Analytics and Microsoft Clarity to understand how users behaved and what they needed. Google Analytics showed me things like which pages users visited most, where they exited the site, and how long they stayed. This helped me see how users moved around and where they got stuck. Microsoft Clarity gave me even more details, like heatmaps showing where users clicked the most and recordings of their actual interactions. By combining these tools, I got a clear picture of what users were doing and where they needed help. This guided my design decisions and led to solutions that will meet their needs effectively.
03.
Qualitative Research
During the ongoing discovery phase, I conducted an unmoderated test to observe how users were using our website in real-time. This allowed me to capture user behavior patterns, identify pain points, address recurring issues, and painpoint areas for general improvement. In conjuction with this, I sent out a survey to 100 participants so I could capture user shopping behaviors, aiming to gain insights into their habits and preferences when making purchasing decisions.
Brainstorming, wireframes and designs
Design
04.
User Flow
Using the data and insights available, I designed a user flow aimed at improving the overall experience and hopully increase conversion rates, keeping the user needs at the center of every decision.
05.
Low Fidelity Wireframes
By creating low-fidelity wireframes, it enabled me to to quickly iterate and explore different design concepts. Because the wireframes were simple, I could easily share my ideas and get feedback from stakeholders and developers, in a collaborative way.
06.
North Star Design
By adopting the North Star design approach, I was able to create a compelling and purposeful experience that not only achieves business objectives but also prioritises user needs. Key improvements include: - Ability to browse or compare the entire website, freely. - Reducing the pressure to register immediately and share personal credentials. - Introducing educational content explaining the benefits of joining Quidco and how cashback works. - Updating the website's design to enhance trustworthiness and modernise the user experience.
Validate hypotheses and design concepts
User testing
07.
Prototyping
Once the designs were completed, it was crucial to validate the design concepts and hypothesis with real users to determine whether the product should be developed further, refined, or discarded. Testing the prototype with real users allows for the identification of usability issues, gathering insights, and iterating on the design to enhance the overall user experience.
Outcome
Before I could validate my 'North Star' design concept, the project was put on hold due to organisational restructuring. However, insights generated by this workstream created a better understanding of user pain points, such usability issues, navigation challenges, and interface complexities, which was used in other projects.
MVP designs
DESIGN